Learning to use datafeeds will improve your niche sites, give you access to more product information and generally help boost your web business. Increased traffic and more sales happen when you keep content unique and fresh, so don’t plan to just plug and play – learn to pick and choose what products and what information will match up with your topics. It works!
There’s more to handling datafeeds than just finding and downloading them:
- Find available feeds, sort categories and download what you need. Then manipulate the information inside.
- Loading those products to the server for your site or creating a post with the images and links.
- Pulling the information into a post template so displaying the feed is “automated”.
- Updating feeds when information changes
What is a datafeed exactly?
The easiest way for me to visualize a datafeed is to see it as a spreadsheet. Even though it is usually presented as a CSV file, that just means commas or tabs are separating the data you would normally see in a spreadsheet cell. You can upload a CSV file into a spreadsheet and, conversely, you can save a spreadsheet as a CSV file.
A datafeed is an inventory sheet of the merchant’s products. Each row (think spreadsheet) represents one product. If the product comes in different sizes, different colors, different anything – each choice will have its own row.
The cells going across the row are for the various bits of information you need to display that product on your site: Name, Landing Page, Large Image, Thumbnail Image, category, Retail Price, Sale Price, etc. There are many ways a network can choose to accept datafeeds; each network usually sets up the template criteria so they are uniformly structured.
How do I get a datafeed from ShareASale?
I marked the Links tab and the Datafeed choice with red dots in the image above. You find these tabs in your ShareASale dashboard as an affiliate. You can also find the same Datafeed choice under the Merchants tab, labeled: Find merchants with Datafeeds.
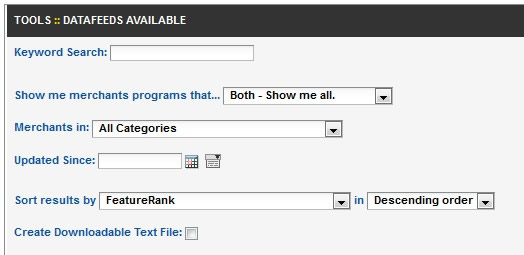
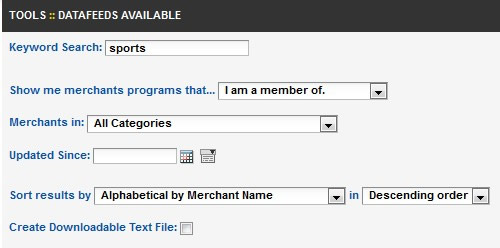
Make some selections to narrow the results:
And then choose a merchant with the number and type of products you’re looking for:
Now let’s take a look at that information graph – Using a different merchant for the following details – don’t get confused, I just wanted to show you more than one!
Full bar gives you lots of info, but it’s too small to really see, so I’ll break it up into 3 pieces for an up-close look right below this image:
Let’s take the first part – from the far left. We see the merchant name, a link to the profile page and some basic details in case you’re deciding whether or not to join:
The second part, moving from the left to the center, gives us more program details (CPC, cookie duration and AutoDeposit) and some important information about the feed. The green circles tell you how many of the SAS datafeed enhancement features this merchant uses. You can also see how many products are in the feed and when it was last updated.
This last piece – the far right of the graphic – is what you’re looking for so you can download or find a specific product. I duplicated the green circles and the number of products so you could find your place, and then on the far right you see 3 choices: Download as a csv (comma separated values) file, or Search Products, and Apply for FTP access, which is a box you check if you want to transfer the file via FTP now or in the future:
Let’s look at Download as csv first. Very straighforward. Click that option and you’ll get this instruction:
The image above tells you that: 1) Once you save this file and open it, you will have to replace USERID with your own affiliate number. Just in case you don’t know your affiliate number, it’s right there (I’ve hidden mine under the gray bar). 2) When your computer asks open or save?, choose Save. Then you can open it with the program of your choice. I use a spreadsheet to open, but remember it’s a csv file, so you have to look for it with *all files instead of just xls or xlsx files. 3) One last thing. When you’re opening the file, your computer will ask you about the format of the data. Data is separated by TABS and not by commas, as you would expect in a csv file. Good to know when you see the options!
Before we stop and let you rearrange your spreadsheet data to suit your site, I want to show you another way to use the datafeed. This way is great for beginners and small sites where 1 or 2 products in a category is plenty. These instructions also show you what it looks like when you get to the datafeed info via the Links tab.
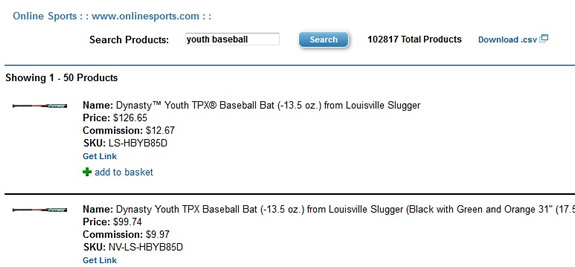
The image above is from the LINKS tab for the merchant OnlineSports. You can see banner choices, text links, coupon deals and datafeed all in one place for the same merchant. In this example, OnlineSports’ datafeed has 102,000+ products. I think we’re going to have to do some search narrowing:
If you look near the Search box, you’ll also see an opportunity to download csv file. This is a great feature for narrowing your results until you get exactly what you want and THEN downloading the file!
We searched for baseball and got way too many, so we narrowed it to youth baseball and as you can see, there are now 50 products showing up that pulled from the entire OnlineSports datafeed. For each product, you see an image and an opportunity to get the individual link if you want, or add it to your “basket”, which is a feature SAS uses to make gathering things easier for affiliates.
If you’re only going to incorporate a few products, the “get link” feature is what you want. When you click it, you’re going to see the various ways the link can be written for you. Text only, large image, thumbnail image, with and without price, merchant name, etc. I hope you can see now that you don’t have to be a technical wizard to find the right products to feature on your site. Learn a few more tricks with datafeeds and you’ll be able to manipulate whole categories of inventory for your niche.
Share


